Kubernetes has become the de facto standard for container orchestration, powering 99% of modern cloud-native projects. While it offers unparalleled scalability and flexibility, organizations often experience sticker shock when their cloud bills arrive. This playbook provides engineering leaders with a comprehensive framework for understanding, monitoring, and optimizing Kubernetes costs without sacrificing performance or reliability.
Based on real-world implementations across dozens of production environments, this blog post addresses the critical financial decisions that CTOs and engineering directors face when running Kubernetes at scale. From choosing between spot and reserved instances to budgeting for observability, we’ll explore the trade-offs that can make or break your cloud budget.
Understanding the true cost of Kubernetes
While Kubernetes itself is open source and technically free, the total cost of ownership extends far beyond the software. Organizations typically see their infrastructure costs double when migrating from simpler solutions like AWS ECS to managed Kubernetes services like EKS.
A recent client migration case study shows this perfectly. Moving from ECS to EKS to meet AWS Marketplace requirements (which mandated Helm packaging) resulted in costs getting doubled. The culprit wasn’t Kubernetes itself, but the architectural changes required and resource over-provisioning that went unaddressed for months.
The Kubernetes cost breakdown
Control plane costs (5%)
- Managed Kubernetes services charge approximately $70-150 per month per cluster
- While seemingly small, multiple environments (dev, staging, production) add up quickly
- Self-managed control planes save money but dramatically increase operational overhead
Worker nodes (40%)
- Virtual machines running your workloads represent the largest cost component
- Includes CPU, memory, storage, and network resources
- Optimization opportunities through right-sizing, spot instances, and autoscaling
Service internals (20%)
- Add-ons and operators that make Kubernetes production-ready
- External DNS, ingress controllers, monitoring agents, security tools
- Often overlooked but can accumulate significant costs
Operational overhead (35%)
- Engineer time for cluster management, upgrades, and incident response
- Often the most expensive component when factoring in senior engineer salaries
- Includes planning, deployment, monitoring, and troubleshooting
Spot, reserved or on-demand: decision matrix
Choosing the right compute model for your Kubernetes nodes is one of the most impactful decisions you can make to optimize costs. Each model offers a different balance of cost, availability, and stability.
Spot instances
This model allows you to bid on and use unused cloud provider capacity at a deeply discounted price (up to 90% off On-Demand). The catch is that the cloud provider can reclaim the instances with a short notice period (typically two minutes). Spot instances are perfect for fault-tolerant, stateless, and flexible workloads that can handle interruptions, such as batch processing, CI/CD runners, or some web services. To use them effectively in Kubernetes, your applications must be designed for resilience using techniques like retries and graceful shutdowns. This results in:
- 50-90% savings compared to on-demand pricing
- Can be reclaimed with 2-minute notice when demand increases
- Best for stateless applications, batch processing, fault-tolerant workloads
Reserved Instances (RIs)/ savings plans
Reserved Instances are where you commit to using a specific instance type for a one- or three-year term in exchange for a significant discount (up to 72%). RIs are best for stable, predictable workloads that will run continuously, such as core production services. The main drawback is the lack of flexibility; if your workload needs change, you may be stuck with an underutilized or mismatched reservation. This results in:
- 20-60% savings with 1-3 year commitments
- Predictable pricing for stable workloads
- Best for production workloads with consistent usage patterns
On-demand instances
This is the default and most straightforward option. You pay for compute capacity by the second or minute without any long-term commitment. On-demand instances offer the highest flexibility and are ideal for unpredictable workloads or short-term testing. However, they come at a premium price. Using on-demand instances results in:
- Pay-as-you-go pricing with no commitments
- Highest cost but maximum flexibility
- Best for variable workloads, development environments, short-term projects
Decision matrix
| Workload type | Recommended compute model | Rationale |
| Mission-critical, stateful applications (e.g., databases) | Reserved or On-Demand | High availability and predictability are non-negotiable. |
| Fault-tolerant, stateless applications (e.g., image processing, CI/CD) | Spot Instances | Cost savings are massive, and the workload can easily recover from interruptions. |
| Unpredictable, spiky traffic (e.g., event-driven APIs) | On-Demand with Horizontal Pod Autoscaling (HPA) | Flexibility to scale up and down quickly is more important than long-term cost savings. |
| Base production workload | Reserved Instances for a baseline, and On-Demand for spikes | A hybrid approach to lock in savings for consistent usage while maintaining flexibility for variable demand. |
Many successful organizations use a hybrid approach:
- 70% Spot instances for general workloads with proper fault tolerance
- 20% On-Demand for critical services and burst capacity
- 10% Reserved for baseline capacity of mission-critical applications
This strategy typically achieves 40-50% cost savings while maintaining high availability through proper application design and cluster autoscaling.
Node pool design and resource right-sizing
The way you structure your Kubernetes worker nodes and allocate resources can have a profound impact on your spending. A well-designed node pool strategy prevents overprovisioning, improves utilization, and ensures your workloads are running on the most cost-effective hardware.
Node pool strategy
Instead of a single, monolithic node pool, consider a multi-node pool approach. Separate your concerns through node pools. An example of this approach is:
- System node pool: Dedicated to Kubernetes system components
- Application node pool: For your business applications
- Batch processing pool: For background jobs and data processing
- GPU node pool: For machine learning workloads (if needed)
This separation allows for independent scaling, different instance types, and targeted cost optimization strategies.
Resource requests and limits
Properly defining resource requests and limits is a fundamental aspect of Kubernetes cost optimization. This is where most overprovisioning occurs.
- Resource requests: This is the minimum amount of CPU and memory a container needs to be scheduled. Setting this too high leads to idle, unused resources. Setting it too low can result in the scheduler placing the pod on a node with insufficient resources, causing it to fail.
- Resource limits: This is the maximum amount of CPU and memory a container can consume. If a container exceeds its memory limit, it will be terminated. If it exceeds its CPU limit, it will be throttled.
The right-sizing process
Before optimization, it’s a good idea to collect 2-4 weeks of resource utilization data on:
- CPU usage patterns (average, peak, 95th percentile)
- Memory consumption over time
- Network I/O requirements
- Storage IOPS and throughput needs
Once the resource utilization data is collected, follow the given right-sizing process:
- Audit current allocation
- Use kubectl top pods and monitoring dashboards
- Identify containers with <30% resource utilization
- Flag applications with memory limits significantly exceeding usage
- Calculate optimal resources
- Set CPU requests at 75th percentile of usage
- Set memory requests at 90th percentile plus 20% buffer
- Ensure limits prevent resource contention
- Gradual implementation
- Start with non-critical environments
- Reduce resources by 25% increments
- Monitor for performance degradation
- Apply lessons learned to production
Use real-world metrics to inform your requests and limits. Tools like Kubecost or the Vertical Pod Autoscaler (VPA) can analyze your application’s historical resource usage and provide data-driven recommendations.
Tools for resource optimization
- Vertical Pod Autoscaler (VPA): The VPA continuously monitors the resource usage of your pods and can automatically adjust their requests and limits. It can run in recommendation mode, where it just provides suggestions without applying them, or in active mode, where it automatically resizes your pods.
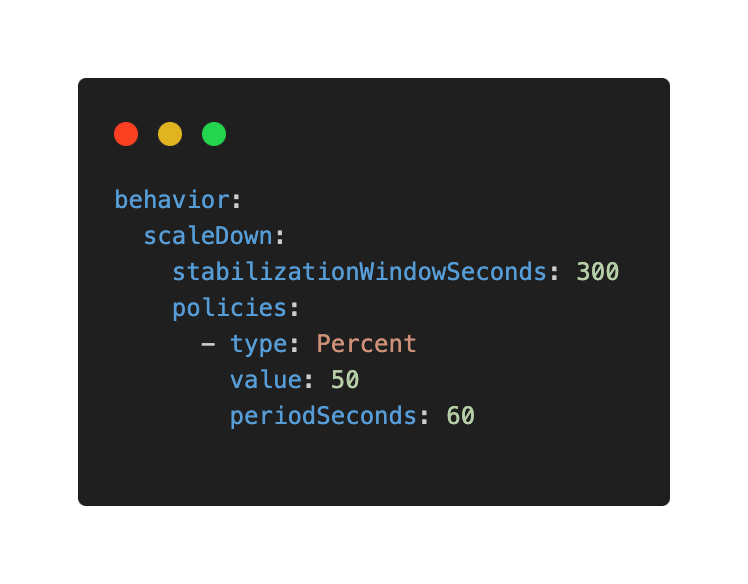
- Horizontal Pod Autoscaler (HPA): The HPA automatically scales the number of pod replicas up or down based on metrics like CPU or memory utilization. Set appropriate scale-down stabilization windows and try to avoid aggressive scaling policies that cause thrashing.
- Karpenter: Karpenter is a high-performance Kubernetes cluster autoscaler that watches for unschedulable pods and launches exactly the right size and type of node to host them. Unlike traditional autoscalers, it doesn’t work with pre-defined node groups, making it highly efficient. Karpenter can mix instances and automatically use spot instances.
Observability: budgeting for metrics, logs, and traces
Observability is a crucial, but often expensive, component of a production-grade Kubernetes cluster. It’s the process of collecting and analyzing data, metrics, logs, and traces to understand the internal state of your applications. It often represents 10-15% of total Kubernetes costs but provides essential visibility into performance, security, and reliability. The challenge lies in balancing comprehensive monitoring with cost control.
Metrics strategy
Metrics are numerical data points that represent a system’s state over time (e.g., CPU utilization, request latency). Tools like Prometheus or VictoriaMetrics are used to collect and store these metrics. The cost is tied to storage and the number of metrics collected. To optimize, ensure you’re only collecting the metrics you need and setting a reasonable retention period.
Traditional Prometheus challenges
- Memory consumption grows linearly with cardinality
- Single-node architecture limits scalability
- Storage costs increase with retention periods
- Query performance degrades over time
VictoriaMetrics advantages
- 50-80% reduction in memory usage compared to Prometheus
- Horizontal scalability through microservices architecture
- Better compression rates for long-term storage
- Compatible with existing Prometheus queries and dashboards
Metrics cost optimization
- Implement metric retention policies based on importance
- Use recording rules for frequently-queried complex metrics
- Regularly audit high-cardinality metrics
- Consider sampling for non-critical metrics
Logging architecture
Logs are detailed, timestamped records of events. Centralized logging with tools like Victoria Logs, Loki, or the ELK Stack (Elasticsearch, Logstash, Kibana) can quickly become a major cost driver due to the sheer volume of data. To optimize, filter out noisy or unnecessary logs at the source, and use a cost-effective storage solution. Some common centralised logging options are:
Elasticsearch/OpenSearch
- Mature ecosystem with rich query capabilities
- Higher resource requirements and operational complexity
- Expensive scaling for large log volumes
Loki
- Prometheus-inspired logging solution
- More cost-effective than Elasticsearch
- Requires S3/GCS for long-term storage
- Steeper learning curve for complex queries
VictoriaLogs (emerging)
- Newer solution from VictoriaMetrics team
- Simplified architecture with local storage
- Still maturing but shows promise for cost reduction
Distributed tracing budget
Traces track the journey of a single request across multiple services. While invaluable for debugging complex microservice architectures, they are also the most expensive form of observability data to collect and store. Use sampling strategies to only trace a fraction of your requests, focusing on high-traffic or error-prone endpoints.
When to implement tracing
- Microservices architectures with > 5 services
- Complex request flows requiring debugging
- Performance optimization initiatives
- Sufficient budget for tooling and expertise
Effective tracing solutions
- Jaeger: Open-source option with reasonable resource requirements
- OpenTelemetry: Vendor-neutral instrumentation
- Datadog APM: Premium option with rich features but higher cost
Tracing sampling strategy
- Implement head-based sampling (1-10% of traces)
- Use tail-based sampling for error scenarios
- Focus on critical user journeys initially
- Gradually expand coverage based on ROI
Treat your observability stack like a separate project with its own budget. Define what you need and, more importantly, what you don’t. Use open-source tools like VictoriaMetrics and Grafana to build a powerful observability stack without the per-GB or per-user costs of some commercial alternatives.
Secrets, backups, snapshots, and compliance costs
Beyond the core compute costs, several other operational expenses can add up. They are:
Secrets management
Solutions like AWS Secrets Manager, HashiCorp Vault, or Kubernetes Secrets CSI Driver store and manage sensitive information. While a necessary security measure, each stored secret and API call to retrieve it can incur costs.
Why does external secrets management matter?
- Kubernetes secrets are base64 encoded, not encrypted at rest by default
- Version control of secrets creates security vulnerabilities
- Compliance requirements often mandate centralized secret management
- Audit trails for secret access and rotation
Some cost-effective secrets solutions are:
HashiCorp Vault
- Self-hosted option with granular access control
- Higher operational overhead but lower recurring costs
- Excellent for organizations with dedicated security teams
Cloud-native solutions
- AWS Secrets Manager: $0.40 per secret per month + API calls
- Azure Key Vault: $0.03 per 10,000 operations
- GCP Secret Manager: $0.03 per 10,000 operations + storage
External secrets operator
- Synchronizes external secrets into Kubernetes
- Reduces API calls through caching
- Supports multiple secret backends
Backups, snapshots and disaster recovery
Regular backups of your persistent volumes and application data are essential for disaster recovery. The cost is related to the storage used and the frequency of snapshots. Define a clear retention policy to avoid holding on to old backups for too long.
What needs backup in Kubernetes
- Persistent volume data
- Kubernetes manifests and configurations
- Secrets and certificates
- Custom resource definitions
- RBAC configurations
Velero: The De-facto standard
- Backs up Kubernetes resources and persistent volumes
- Supports multiple cloud storage backends
- Disaster recovery and cluster migration capabilities
- Resource cost: $0.023 per GB per month (AWS S3 standard)
Snapshot management
- Enable automatic EBS/GCE disk snapshots
- Implement retention policies (7 daily, 4 weekly, 12 monthly)
- Use incremental snapshots to reduce storage costs
- Tag snapshots for cost allocation and compliance
Compliance and security costs
Compliance requirements (e.g., SOC 2, HIPAA) often necessitate additional tools and services, such as network policy engines, vulnerability scanners, and audit logging. These services, and the time spent on maintaining them, contribute to your overall operational costs.
Encryption requirements
- Encrypt all data at rest (no additional cost in most clouds)
- Use TLS for all communications
- Implement certificate management with cert-manager
Audit logging
- Kubernetes audit logs for compliance tracking
- CloudTrail/Activity Logs for infrastructure changes
- Centralized logging for security event correlation
Security scanning and policies
- Container image vulnerability scanning
- Policy enforcement with tools like OPA Gatekeeper
- Network policies for micro-segmentation
- Regular security assessments and penetration testing
Recommended tools: VPA, Karpenter, VictoriaMetrics, Grafana
Vertical Pod Autoscaler (VPA)
An open-source tool that automatically adjusts the resource requests and limits of your pods based on their historical usage.
Deployment approach
- Begin in “recommendation mode” to avoid pod restarts
- Focus on stateless applications first
- Exclude databases and stateful services initially
- Gradually enable automatic updates for dev environments
VPA configuration best practices
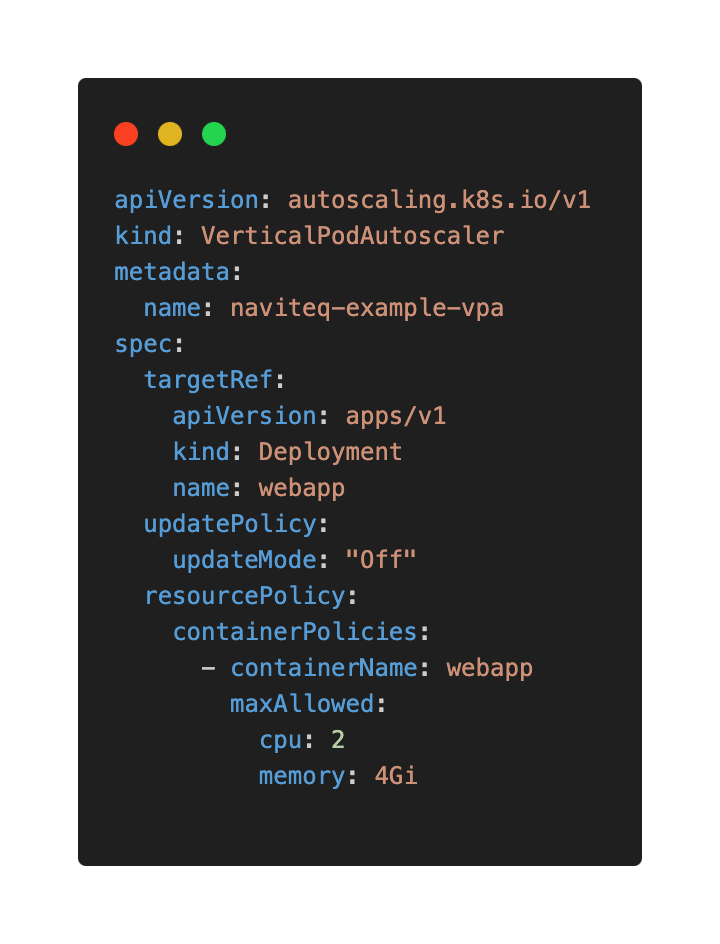
Karpenter
An open-source, high-performance cluster autoscaler that simplifies and optimizes the provisioning of new nodes. It works by launching a new node only when a pod is unschedulable and then selecting the most cost-effective instance type for that specific pod.
Key advantages over cluster autoscaler
- Provisions right-sized nodes for pending pods
- Automatic spot instance diversification
- Faster scaling with sub-minute node provisioning
- No pre-defined node groups required
Migration strategy
- Deploy Karpenter alongside existing node groups
- Gradually shift workloads to Karpenter-managed nodes
- Monitor cost impact and stability
- Deprecate traditional node groups once confident
Sample Karpenter NodePool configuration
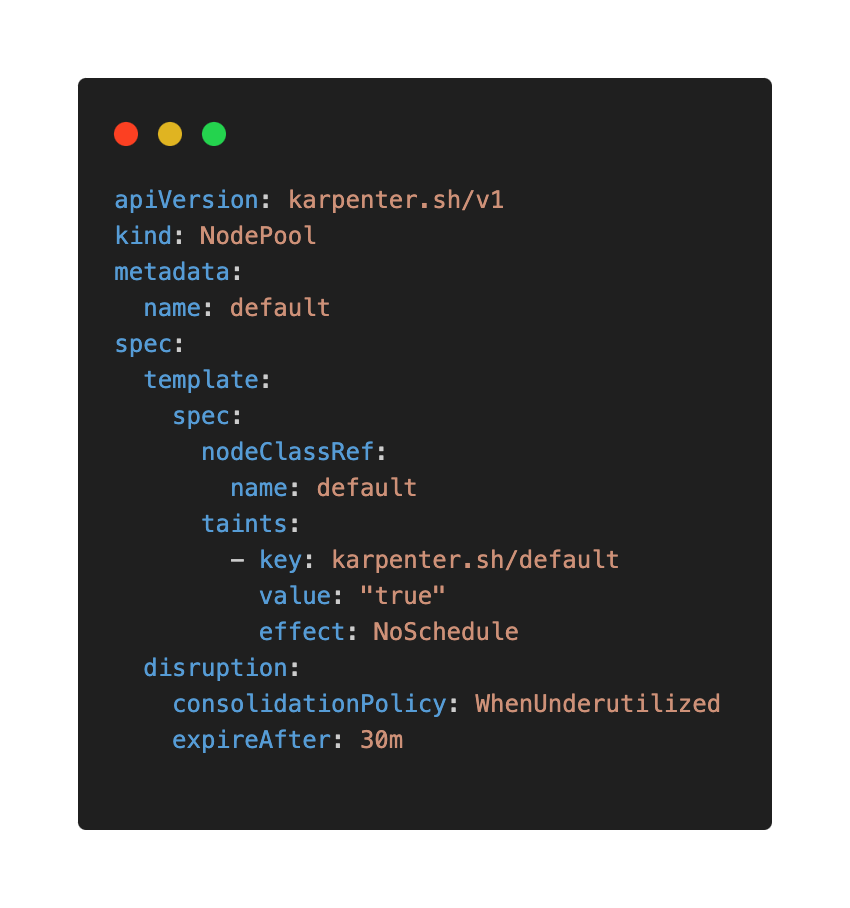
Expected ROI: 25-50% reduction in compute costs through optimal instance selection and spot usage.
VictoriaMetrics
A fast, cost-effective, and scalable open-source monitoring solution and time-series database. It is a more efficient alternative to Prometheus, especially for large-scale deployments.
Migration from Prometheus
- Deploy VictoriaMetrics cluster components
- Configure Prometheus to remote-write to VictoriaMetrics
- Gradually migrate dashboards and alerting rules
- Decommission Prometheus after validation period
Resource savings
- Major reduction in memory usage
- Major reduction in storage requirements
- Improved query performance for large datasets
- Better long-term data retention economics
Grafana
A leading open-source analytics and visualization platform. You can use it to create beautiful and informative dashboards to monitor your Kubernetes cluster’s performance and costs using data from sources like VictoriaMetrics or Prometheus.
Essential Kubernetes dashboards
- Cluster resource utilization and costs
- Node efficiency and waste identification
- Application performance and resource usage
- Cost allocation by team or namespace
Key metrics to track
- Cost per pod, namespace, and cluster
- Resource efficiency (requested vs. used)
- Spot instance interruption rates
- Storage utilization and growth trends
Implementation roadmap
An easy roadmap you can follow to optimize your Kubernetes cost is as follows:
Phase 1: visibility (months 1-2)
- Deploy Kubecost for cost tracking
- Implement resource utilization monitoring
- Establish baseline metrics and KPIs
- Create cost allocation model
Phase 2: quick wins (months 2-3)
- Right-size obviously over-provisioned resources
- Implement pod resource requests and limits
- Schedule down dev/test environments during off-hours
- Enable basic horizontal pod autoscaling
Phase 3: advanced optimization (months 3-6)
- Deploy Karpenter for intelligent node management
- Implement spot instance strategies
- Optimize observability stack (VictoriaMetrics migration)
- Advanced autoscaling with KEDA
Phase 4: continuous improvement (ongoing)
- Quarterly cost optimization reviews
- Automated policy enforcement
- Advanced scheduling and placement strategies
- Cost optimization culture and training
Key Performance Indicators(KPIs) of success
The key performance indicators for measuring success are as follows:
Cost efficiency metrics
- Cost per pod per month
- Resource utilization percentage (target: >70%)
- Spot instance coverage (target: >50%)
- Month-over-month cost trends
Operational metrics
- Time to detect cost anomalies (target: <24 hours)
- Resource right-sizing frequency (target: monthly)
- Failed deployment rate due to resource constraints (target: <1%)
Business impact
- Total cloud cost as percentage of revenue
- Engineering team productivity (measured by deployment frequency)
- Infrastructure cost per customer or transaction
Organizations following this playbook typically achieve Faster scaling and better application performance and enhanced visibility and predictability of cloud spending.
Conclusion
Kubernetes cost optimization and management is not a one-time project but an ongoing practice that requires tooling, process, and cultural change. By implementing the strategies outlined in this playbook, engineering leaders can achieve significant cost savings while maintaining or improving system reliability and performance.
The key to success lies in combining the right tools with regular optimization cycles and strong cost visibility. Start with quick wins to build momentum, then gradually implement more sophisticated optimization strategies as your team’s expertise grows.
Naviteq‘s experts can guide you through this journey, helping you identify and implement the most impactful optimizations for your specific environment. Remember that every dollar saved on infrastructure costs can be reinvested in product development, team growth, or new technology initiatives. In today’s competitive landscape, efficient resource utilization isn’t just about cost savings, it’s about sustainable business growth.
Ready to optimize your Kubernetes costs?
Contact Naviteq today for a free consultation with a Naviteq engineer to identify immediate savings opportunities and develop a customized optimization strategy for your organization.